Abstract
The past three decades have seen space-based observation platforms revolutionizing archaeological methodology by enabling non-invasive detection and analysis of archaeological features at unprecedented spatial scales. We examine the transformative impact of satellite remote sensing technologies on archaeological research. This paper systematically compares ten distinct remote sensing techniques—optical/visual, near-infrared (NIR), short-wave infrared (SWIR), thermal infrared (TIR), passive microwave, synthetic aperture radar (SAR), light detection and ranging (LiDAR), multispectral imaging, hyperspectral imaging, and GNSS reflectometry—analyzing their underlying principles, technical capabilities, limitations, and specific archaeological applications. Each of these techniques offers unique capabilities for archaeological prospection. In case studies drawn from multiple geographical regions and cultural contexts, we review how these technologies have fundamentally altered archaeological understanding of past human landscapes at scales previously unattainable through traditional methods. Integrating multiple remote sensing approaches has revealed entire settlement systems, forced reassessment of ancient population densities and environmental impacts, and enabled systematic documentation of threatened archaeological landscapes worldwide.
Citation
Lorem ipsum dolor sit amet, consectetur adipiscing elit. Nullam placerat sem condimentum, mattis erat ut, rhoncus eros. Duis ut justo nunc. Nullam consequat, diam id sollicitudin sollicitudin, nisi arcu dignissim leo, vel interdum ligula nulla vel velit. Duis faucibus eget lectus in tristique. Aenean condimentum id lorem tempor tempus. Morbi ut vestibulum arcu. Vivamus in ex quis nibh gravida rutrum eget et purus.
Dates
Keywords
Archaeological remote sensing; Satellite archaeology; LiDAR; Synthetic Aperture Radar; Multispectral imaging; Hyperspectral imaging; Landscape archaeology; Non-invasive archaeology; Cultural heritage management; Space archaeology; Thermal imaging; Archaeological prospection; Maya archaeology; Archaeological survey methods; Mesopotamian archaeology
1.0 Introduction
The development of satellite remote sensing technologies has fundamentally transformed archaeological practice, creating new pathways for discovery and analysis that were unimaginable a generation ago (Lasaponara & Masini 2011; Luo et al. 2019). We are witnessing a paradigm shift in archaeological methodology; technologies originally developed for military reconnaissance, environmental monitoring, and planetary exploration now reveal hidden dimensions of our human past. These space-based observation platforms have become critical tools for archaeological discovery. Optical and near-infrared sensors detect subtle vegetation stress above buried structures (Verhoeven 2012). Thermal imaging reveals subsurface features through differential heating and cooling patterns (Casana et al. 2017). Synthetic Aperture Radar penetrates dense vegetation and cloud cover to expose landforms modified by ancient civilizations (Tapete & Cigna 2019). At the same time, LiDAR creates high-precision three-dimensional models that strip away forest canopy to reveal hidden archaeological landscapes (Chase et al. 2011; Evans et al. 2013). Hyperspectral imaging identifies specific materials and chemical signatures associated with human activity (Liang 2012), while emerging technologies like GNSS Reflectometry track subtle environmental changes affecting archaeological sites.
The impact of these technologies on archaeological enquiry has been profound. Entire civilizations have been rediscovered, forcing us to fundamentally reassess scale, complexity, and environmental impact. In the Maya lowlands, LiDAR surveys revealed that this ancient civilization modified their landscape far more extensively than previously imagined, supporting population densities that archaeologists had once dismissed as impossible (Canuto et al. 2018). In the Amazon basin, extensive ancient agricultural systems and settlement networks were identified through remote sensing in areas long considered pristine wilderness, fundamentally challenging narratives about human impact on tropical environments (Prümers et al. 2022).
Perhaps most significantly, satellite remote sensing has democratized archaeological discovery, enabling systematic documentation of archaeological landscapes at regional and even continental scales (Opitz & Herrmann 2018). Features that might take decades to document through ground survey can now be mapped in weeks, allowing archaeologists to study ancient settlement patterns, agricultural systems, and transportation networks at unprecedented scales. While most archaeologists still investigate the monumental centers that have traditionally dominated archaeological research, this approach reveals how ancient societies organized their landscapes, managed environmental challenges, and developed complex infrastructure networks that often extended far beyond those monumental centers.
As we explore the diverse remote sensing techniques that have driven this revolution, we will examine not just the sophisticated technologies themselves but the transformative insights they have provided about past human societies across the globe. From detecting subtle crop marks above buried Roman villas to mapping entire kingdoms hidden beneath tropical forest canopy, satellite remote sensing has opened new windows into our shared human heritage, revealing ancient worlds hiding in plain sight.
2.0 Satellite remote sensing techniques
2.1 Optical/Visual Remote Sensing
Technique Overview. Optical remote sensing is the most intuitive form of Earth observation. It captures images in the visible light spectrum (0.4-0.7 μm) similar to how human eyes perceive the world. These systems record the sunlight reflected from Earth’s surface, measuring intensity across blue, green, and red wavelengths. Modern optical satellites like WorldView-4 and Pleiades can achieve sub-meter resolution, distinguishing objects as small as 30cm across from space.
The fundamental principle involves passive detection of naturally reflected sunlight, which limits operations to daylight hours and clear weather conditions. The technology has evolved dramatically since the first Landsat mission in 1972, with improvements in spatial resolution (from 80m to <0.5m), spectral capabilities, and revisit frequencies (from weeks to daily).
Optical imagery offers exceptional spatial detail and color information, making features easily recognizable to human interpreters. Compared to other remote sensing types, the data is relatively straightforward to process and analyze. Modern systems typically provide multispectral capabilities within the visible range, allowing for true-color and false-color composites.
The primary limitations include the inability to penetrate clouds, vegetation, or operate at night. Atmospheric conditions like haze, smoke, or dust can significantly degrade image quality, and seasonal vegetation variations can mask interesting features. Despite these constraints, optical remote sensing remains the backbone of Earth observation programs worldwide due to its intuitive interpretation and diverse applications across environmental monitoring, urban planning, disaster response, and cultural heritage management.
Archaeological Applications. Optical remote sensing revolutionized archaeological prospection by enabling broad landscape surveys impossible through traditional ground methods. The discipline of “space archaeology” emerged largely through optical satellite imagery, with pioneering work by NASA’s Sarah Parcak demonstrating its effectiveness in identifying previously unknown archaeological sites (Parcak 2017).
In Egypt, optical satellite data helped identify thousands of unmarked tombs, settlements, and even pyramid sites by detecting subtle soil and vegetation differences invisible at ground level. The contrast between disturbed soils from ancient structures and the surrounding matrix creates distinctive signatures visible from space. In Egypt, high-resolution optical imagery led to the discovery of 17 pyramids, 3,100 settlements, and 1,000 tombs (Parcak et al. 2016).
In Mesopotamia, optical imagery proved invaluable for documenting ancient sites threatened by conflict and looting. DigitalGlobe’s satellite imagery revealed extensive damage to archaeological sites like Nimrud and Hatra in Iraq, allowing documentation of cultural heritage destruction that would otherwise go unrecorded (Zingaro et al. 2023). The same technology helps archaeologists track looting patterns across regions like Syria, where ground access is impossible.
In Central America, optical imagery was crucial in revealing ancient Maya sites hidden beneath the tropical canopy. Research at sites like Caracol in Belize used seasonal variations in vegetation stress above buried structures to map extensive urban complexes. As revealed through optical imagery, the city proved far larger and more complex than ground surveys had indicated (Chase et al. 2011).
Archaeologists used optical imagery to reveal vast networks of ancient water management systems at Angkor Wat in Cambodia. By using subtle topographic and vegetation patterns visible from space, they learned that Angkor was supported by a sophisticated hydraulic network spanning over 1,000 square kilometers. This research fundamentally changed the view of the site’s scale and complexity (Evans et al. 2013).
In Mediterranean landscapes, optical imagery helps identify subtle remnants of Roman centuriation (agricultural field systems) that persist in modern field boundaries. Once visible only in fragments, these ancient land divisions can now be mapped across entire regions, revealing imperial Roman land management patterns at unprecedented scales (Philip et al. 2002).
2.2. Near-Infrared (NIR) Remote Sensing
Technique Overview. Near-infrared (NIR) remote sensing operates in wavelengths just beyond the visible spectrum (0.7-1.4 μm), capturing energy invisible to the human eye but rich in information about Earth’s surface. This portion of the electromagnetic spectrum is particularly sensitive to vegetation characteristics, water content, and specific mineral properties, offering insights unavailable through visible light alone.
Like optical sensing, NIR is a passive technique that detects naturally reflected sunlight. It requires daytime conditions and relatively clear skies. But NIR radiation can penetrate thin clouds and atmospheric haze more effectively than visible light, which provides greater data acquisition flexibility.
The most distinctive characteristic of NIR sensing is its exceptional sensitivity to plant physiology. Healthy vegetation strongly reflects NIR radiation (creating the so-called “red edge” in spectral profiles) while absorbing visible red light for photosynthesis. This dramatic contrast allows precise assessment of vegetation health, biomass, and species differentiation. The normalized difference vegetation index (NDVI), which compares NIR and red reflectance, has become a fundamental tool in environmental monitoring and agricultural management.
NIR also exhibits strong interaction with water molecules, making it effective for delineating water bodies, assessing soil moisture, and identifying irrigated lands. In geological applications, NIR helps distinguish certain rock and mineral types through characteristic absorption features, supporting geological mapping and mineral exploration.
Modern satellite systems typically incorporate NIR bands alongside visible wavelengths. Common platforms include Landsat (30m resolution), Sentinel-2 (10-20m), and commercial systems like Planet and WorldView, which offer NIR capabilities at resolutions down to 3m and 0.3m, respectively. The widespread availability of NIR data, often combined with visible bands, has made it a standard component of Earth observation programs and land cover analysis worldwide.
Archaeological Applications. Near-infrared remote sensing has transformed archaeological prospection by revealing subsurface features invisible to the naked eye. Its particular sensitivity to vegetation stress and soil moisture differences makes it exceptionally valuable for identifying buried archaeological remains that affect plant health or soil characteristics above them (Verhoeven 2008, 2012).
NIR imagery has proven extraordinarily effective in revealing ancient Roman villas, field systems, and roads in the Mediterranean basin. At sites across Italy, buried wall foundations create subtle moisture stress in crops growing above them. While these “crop marks” may be barely visible in natural color imagery, they appear with striking clarity in NIR. Research in the Roman Campagna used NIR imagery to map extensive networks of rural villas and associated field systems, revealing settlement patterns impossible to discern through ground survey alone (Agapiou et al. 2013).
In the Middle East, NIR has helped identify ancient hollow ways—depressed trackways formed by centuries of human and animal movement. These subtle landscape features appear in NIR imagery as moisture-retaining depressions with distinctive vegetation signatures. Research in northern Mesopotamia used NIR data to map extensive networks of Bronze Age hollow ways radiating from ancient tells, demonstrating movement patterns and economic connections spanning thousands of square kilometers (Agapiou 2019).
The sensitivity of NIR to soil moisture has proven particularly valuable in desert environments like Egypt’s Nile Delta. Here, buried mud-brick structures retain moisture differently than surrounding soils, creating subtle NIR signatures invisible in natural color imagery. NIR imagery revealed extensive urban networks at sites like Tanis, mapping entire street systems and identifying hundreds of previously unknown structures beneath the desert surface (Parcak et al. 2017).
NIR has helped identify ancient field systems buried beneath peat bogs in northern Europe. The distinctive vegetation stress created by buried stone field boundaries creates linear patterns visible only in NIR wavelengths. In Ireland’s County Mayo, NIR imagery revealed extensive Bronze Age field systems preserved beneath medieval and modern landscapes, demonstrating agricultural intensification dating back over 3,000 years (Hill et al. 2020).
Perhaps most significantly, NIR’s ability to penetrate shallow water has aided underwater archaeology in coastal environments. In the eastern Mediterranean, NIR imagery has helped map submerged harbors and coastal structures at sites like Caesarea Maritima, revealing the full extent of Roman maritime infrastructure now partially submerged by rising sea levels.
2.3. Short-wave Infrared (SWIR)
Technique Overview. Short-wave infrared (SWIR) remote sensing occupies wavelengths between 1.4-3.0 μm, positioned between near-infrared and thermal infrared in the electromagnetic spectrum. This spectral region offers unique capabilities for Earth observation due to its distinctive interaction with water molecules, minerals, and atmospheric conditions.
SWIR radiation is reflected solar energy rather than emitted thermal radiation. This characteristic defines it as a passive remote sensing technique that requires sunlight. However, SWIR offers significant advantages over visible and near-infrared satellite remote sensing in certain conditions. It can penetrate thin clouds, haze, and smoke more effectively, providing usable imagery in conditions that would render visible-light sensing ineffective. This property makes SWIR particularly valuable for monitoring tropical regions with persistent cloud cover or during wildfire events.
SWIR is sensitive to moisture content. Since water absorbs SWIR radiation at specific wavelengths, it creates distinctive absorption features that allow precise moisture measurement in vegetation, soils, and snow. This sensitivity effectively monitors landscapes’ drought conditions, vegetation stress, and soil moisture patterns.
SWIR is excellent for geological research, as many minerals and rocks display characteristic absorption features in this spectral range. Clay minerals, carbonates, and hydrothermal alteration products have distinctive SWIR signatures, enabling detailed geological mapping and mineral identification from space.
Modern satellite systems with SWIR capabilities include Landsat (30m resolution), Sentinel-2 (20m), and specialized sensors like ASTER (30m). Commercial providers like WorldView-3 offer SWIR imagery at resolutions as high as 3.7m, though typically at significantly higher cost than visible/NIR data. While SWIR sensors require more sophisticated technology than visible-light sensors and often offer lower spatial resolution, they provide invaluable complementary information for comprehensive Earth observation programs.
Archaeological Applications. SWIR’s sensitivity to soil mineralogy has proven valuable for identifying ancient settlement sites in arid regions. In Jordan’s Wadi Faynan, SWIR imagery distinguished subtle changes in soil chemistry associated with ancient metallurgical activities, revealing extensive copper production landscapes dating from the Bronze and Iron Ages. These industrial areas, virtually invisible in natural-color imagery, demonstrate sophisticated resource processing networks that supported early urban societies (Casana & Ferwerda 2023).
SWIR has proven particularly effective for mapping ancient agricultural landscapes. In Arizona’s Sonoran Desert, SWIR bands helped archaeologists map prehistoric agricultural fields based on subtle differences in soil composition. Ancient Hohokam irrigation systems in Arizona created lasting changes in soil mineralogy that appear clearly in SWIR imagery but remain invisible in natural color images. This research revealed agricultural intensification patterns extending across hundreds of square kilometers, fundamentally changing the understanding of Hohokam agricultural capacity.
SWIR’s ability to penetrate vegetation more effectively than visible light has aided archaeological surveys in semi-arid environments like the Mediterranean. In Greece and Turkey, SWIR imagery was used to document terraced agricultural systems on hillslopes now covered with maquis vegetation. These extensive agricultural landscapes, dating from Classical through Byzantine periods, demonstrate intensive land management strategies previously underestimated by archaeologists.
The geological sensitivity of SWIR has helped identify ancient quarry sites across landscapes. In Egypt, SWIR imagery distinguished specific limestone formations used in pyramid construction, allowing archaeologists to map transportation networks between quarries and monument sites. This work revealed the full extent of resource extraction landscapes supporting ancient Egyptian monumental construction, identifying dozens of previously unknown quarry sites.
SWIR’s all-weather capabilities have proven valuable for monitoring archaeological sites in regions with seasonal cloud cover. This proved critical in Cambodia where SWIR imagery captured during monsoon seasons revealed additional water management features at Angkor that were invisible during dry seasons.
2.4 Thermal Infrared (TIR)
Technique Overview. Thermal infrared (TIR) remote sensing captures wavelengths between 3.0 and 14.0 μm, detecting heat energy emitted by Earth’s surface rather than reflected sunlight. This fundamental difference distinguishes TIR from shorter wavelength techniques, making it usable 24 hours a day, regardless of solar illumination. TIR sensors measure minute temperature differences across landscapes, typically resolving variations of less than 0.1°C.
The physical principle underlying TIR sensing is that all objects above absolute zero emit thermal radiation, with the intensity and spectral distribution determined by surface temperature and emissivity (a material’s efficiency in emitting thermal energy). Different materials can have identical temperatures but different emissivities, allowing TIR to distinguish between surface types even when their temperatures are similar.
TIR data is typically collected in mid-infrared (3-5 μm) or long-wave infrared (8-14 μm) atmospheric windows, where atmospheric absorption is minimized. Modern satellite systems with TIR capabilities include Landsat (100m resolution), MODIS (1km), and specialized sensors like ASTER (90m). Compared to visible imagery, the relatively coarse spatial resolution results from technical challenges in constructing high-resolution thermal detectors and the inherent diffusion of thermal signals.
A distinctive characteristic of TIR is its ability to detect diurnal temperature variations, which differ markedly between materials based on their thermal inertia (resistance to temperature change). Dense materials like stone heat and cool more slowly than soil or vegetation, creating thermal contrasts most pronounced at dawn and dusk. This “thermal inertia mapping” can reveal subsurface features invisible in daylight imagery.
While TIR can operate at night and through thin clouds, it is affected by atmospheric moisture and is typically less valuable during rainfall events. Despite these limitations, TIR provides unique information about surface composition, moisture content, and energy balance that is impossible to obtain through other remote sensing methods.
Archaeological Applications. Thermal infrared remote sensing offers archaeologists unique capabilities for detecting subsurface features based on how they affect surface temperature patterns. The differential heating and cooling principle between buried structures and the surrounding soil matrix creates thermal signatures that can reveal archaeological sites invisible to other techniques (Casana et al. 2017; Walker 2020).
TIR has proven exceptionally valuable in the Middle East for detecting buried mud-brick architecture. Research in the Jordan Valley used pre-dawn TIR imagery to identify extensive Bronze and Iron Age settlements where buried mud-brick walls retain heat differently than surrounding soils. At Tell Beit She’an, thermal imagery revealed complete urban plans, including streets, buildings, and fortification systems, which are invisible in visual imagery and difficult to map through excavation alone.
In Europe, TIR has revolutionized the study of Roman infrastructure. In Italy’s Po Valley, archaeologists used thermal imagery to map entire Roman centuriation systems (field boundaries) obscured by centuries of agricultural activity. The buried stone boundaries retain heat longer than surrounding soils, creating linear patterns visible only in thermal imagery collected at specific times of day. Similar techniques in Britain revealed previously unknown Roman roads, villas, and field systems across landscapes now dominated by modern agriculture (Brooke 2018).
TIR has proven particularly valuable for archaeological prospection in desert environments. Research in Egypt’s Eastern Desert used thermal imagery to identify ancient mining operations where subtle differences in surface composition created distinctive thermal patterns. These industrial landscapes, associated with Roman and earlier extraction activities, revealed economic networks extending far beyond known settlement areas.
In Mesoamerica, thermal imaging revealed extensive ancient agricultural systems in the Maya lowlands. Research at sites like Tikal identified vast systems of terraces, raised fields, and water management features based on the differential thermal properties of modified soils. These agricultural landscapes, far more extensive than previously recognized, fundamentally altered the understanding of Maya agricultural capacity and population density.
The diurnal thermal properties captured by TIR have proven especially valuable for identifying shallow buried features. In the American Southwest, pre-dawn thermal imagery revealed extensive Ancestral Puebloan water management systems at Chaco Canyon, where subtle changes in soil moisture affected the cooling rates of the ground surface. These previously undocumented water control features demonstrated sophisticated environmental adaptation strategies in this arid landscape (Hill et al. 2020).
Perhaps most dramatically, TIR has aided archaeological documentation in conflict zones where ground access is impossible. In Syria and Iraq, thermal imagery helped document looting patterns and intentional destruction at archaeological sites during recent conflicts. The disturbed soil from looting pits displays distinctive thermal properties, allowing monitoring of cultural heritage threats from space when ground assessment is impossible.
2.5 Passive Microwave
Technique Overview. Passive microwave remote sensing operates in wavelengths between 0.1 and 100 cm, detecting naturally emitted microwave radiation from Earth’s surface and atmosphere. Unlike shorter wavelength techniques, passive microwave sensing can operate in virtually any weather condition, day or night, penetrating clouds, precipitation, dust, and smoke that would render optical systems ineffective.
The fundamental principle of passive microwave remote sensing is measuring the naturally emitted microwave energy, which varies based on the physical temperature and emissivity of surfaces. Unlike thermal infrared, microwave wavelengths are long enough to interact with the internal structure of materials rather than just surface properties. This allows passive microwave to detect properties invisible to optical sensors, including soil moisture several centimeters below the surface, sea ice thickness, snow water equivalent, and atmospheric water vapor profiles.
The defining characteristic of passive microwave is its exceptional sensitivity to water in all forms. Since water exhibits distinctive microwave emission properties in comparison to dry surfaces, this allows precise measurement of soil moisture, ocean surface salinity, precipitation, and atmospheric water vapor. This sensitivity makes passive microwave invaluable for hydrologic cycle monitoring and weather forecasting.
The primary limitation is spatial resolution. The built-in physics of microwave detection means that achieving high spatial detail requires either enormous antenna sizes or complex synthetic aperture techniques. Consequently, passive microwave systems typically provide resolutions from 5 to 50 kilometers, significantly coarser than optical imagery. Common satellite systems include SMOS and SMAP for soil moisture (35-50km resolution), AMSR-E/2 for multiple applications (5-50km), and specialized sensors on weather satellites.
Despite resolution limitations, passive microwave provides unique data that is impossible to obtain through other means, particularly for global hydrological monitoring, sea ice mapping, and all-weather observation capabilities. Its ability to measure soil moisture beneath vegetation canopy and clouds makes it particularly valuable for continuous environmental monitoring regardless of atmospheric conditions.
Archaeological Applications. While passive microwave remote sensing might seem an unlikely tool for archaeology given its coarse resolution, it provides critical environmental context for understanding ancient landscape use and climate-human interactions. The technique’s ability to penetrate clouds and vegetation to measure soil moisture creates unique insights into hydrological patterns affecting archaeological landscapes.
Archaeologists studying paleoenvironmental conditions have used passive microwave soil moisture data to correlate modern hydrological patterns with ancient settlement distributions. In Mesopotamia, research combined passive microwave-derived soil moisture maps with archaeological settlement surveys to demonstrate how Bronze Age cities clustered along zones of optimal moisture availability in this semi-arid landscape. This analysis helped explain settlement pattern shifts in response to climate fluctuations during the third millennium BCE.
In North Africa, passive microwave monitoring of soil moisture patterns helped reconstruct the extent of the “Green Sahara” period (approximately 10,000-5,000 years ago) when this now-desert region supported extensive human occupation. By identifying subtle moisture signatures that persist in the modern landscape, researchers mapped ancient hydrological networks that supported hunter-gatherer and early pastoral communities. These paleoenvironmental reconstructions provided crucial context for understanding how climate change triggered major population movements at the end of this humid period.
In Northern Europe, passive microwave monitoring of permafrost conditions has aided archaeological research in Arctic regions. As climate change accelerates permafrost thaw, previously frozen archaeological materials are increasingly at risk of degradation. Passive microwave data helps archaeologists prioritize threatened sites by identifying areas experiencing the most rapid permafrost changes, directing limited resources to sites at greatest risk of loss.
In coastal archaeology, passive microwave’s ability to detect sea ice conditions has supported research on maritime adaptations in Arctic and sub-Arctic regions. Studies of Inuit and earlier maritime cultures used passive microwave sea ice records to correlate settlement patterns with historical ice conditions, demonstrating how these societies adapted to changing maritime access over centuries of occupation.
At a methodological level, passive microwave provides crucial ground-truthing for paleoclimatic models that archaeologists use to understand ancient environmental conditions. In the Eastern Mediterranean, reconstructions of Bronze Age climate conditions incorporate passive microwave-derived soil moisture patterns as baseline data, helping calibrate models of past environmental conditions that may have influenced societal changes like the Late Bronze Age collapse around 1200 BCE.
Passive microwave precipitation and soil moisture data help archaeologists understand ancient agricultural adaptations in regions prone to monsoons. Research in the Indus Valley correlated passive microwave-derived precipitation patterns with settlement distribution during the Harappan civilization, revealing how ancient farmers adapted to monsoon variability through different regional water management strategies.
2.6 Synthetic Aperture Radar (SAR)
Technique Overview. Synthetic Aperture Radar (SAR) is one of the most sophisticated forms of remote sensing. It uses active microwave pulses (typically 1-30 cm wavelength) to create high-resolution images of Earth’s surface regardless of weather conditions or solar illumination. Unlike passive sensors, SAR systems transmit their own microwave signals and measure the backscattered energy returning from the ground, giving them 24/7 all-weather capabilities.
The “synthetic aperture” principle refers to using satellite or aircraft motion to simulate a much larger antenna than physically exists on the platform. As the satellite moves along its orbit, it collects radar returns from multiple positions, which are then computationally combined to achieve far higher resolution than would be possible with a static radar system. This approach allows modern SAR systems to achieve resolutions from 1 to 20 meters despite using relatively long wavelengths.
SAR’s interaction with Earth’s surface differs fundamentally from optical sensing. Radar backscatter depends on surface roughness, geometric structure, and dielectric properties (determined mainly by moisture content) rather than color or temperature. Smooth surfaces like calm water appear dark in SAR imagery as they reflect the radar beam away from the sensor, while rough surfaces or structures oriented toward the sensor appear bright. This side-looking geometry creates distinctive shadowing effects that highlight subtle topographic features.
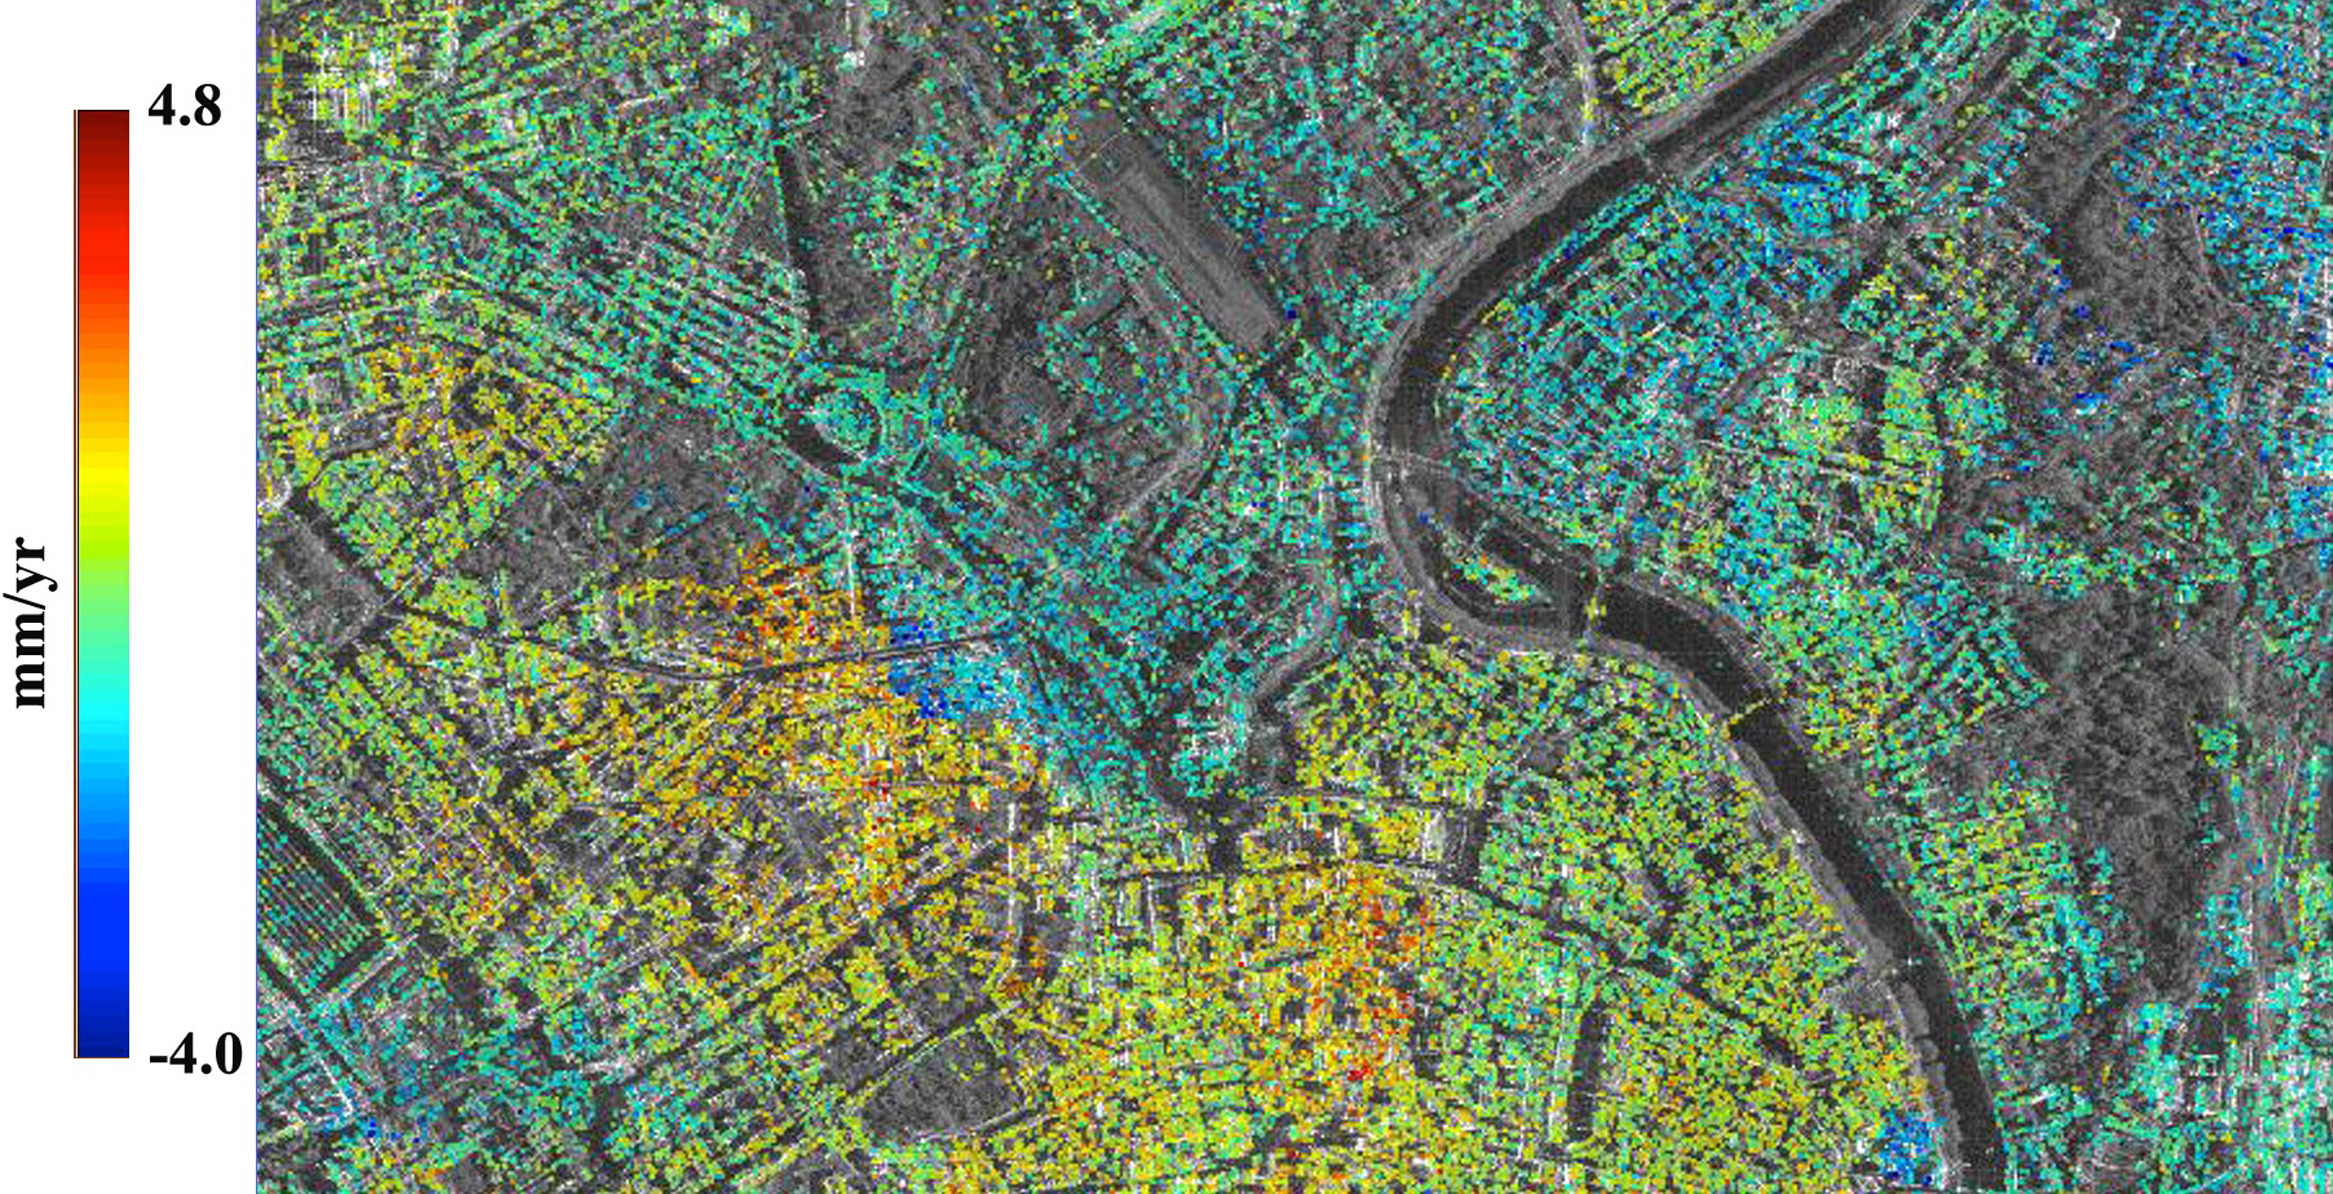
SAR interferometry (InSAR) is a particularly powerful capability. It compares phase differences between images acquired from slightly different positions or times to measure surface displacement with millimeter-level precision. This technique enables the detection of subtle ground movement from earthquakes, volcanic inflation, landslides, and even infrastructure stability.
Modern SAR systems operate in different frequency bands (X, C, and L-band being most common), each offering different penetration capabilities. L-band (23 cm wavelength) can penetrate deeper into vegetation and soil than X-band (3 cm), offering different information about surface and subsurface properties. Key satellite systems include Sentinel-1 (C-band, 5-20m resolution), RADARSAT-2 (C-band, 1-100m), and ALOS-2 (L-band, 3-10m), with numerous commercial systems offering even higher resolutions.
Archaeological Applications. SAR has revolutionized archaeological prospection through its unique ability to penetrate vegetation, reveal subtle topographic features, and operate regardless of weather conditions. It is particularly strong in detecting human-modified landscapes in challenging environments like rainforests, deserts, and conflict zones (Comer & Blom 2006; Tapete & Cigna 2019).
Perhaps most dramatically, L-band SAR revealed extensive ancient Maya settlements beneath the dense canopy of the Guatemalan rainforest. The PACUNAM LiDAR Initiative, combining airborne LiDAR with satellite SAR data, identified over 60,000 previously unknown structures in the Maya Biosphere Reserve. SAR penetrated the vegetation canopy, revealing subtle topographic signatures of ancient buildings, causeways, and agricultural systems. This demonstrates that Maya civilization was far more extensive and densely populated than previously recognized (Stewart et al. 2016).
SAR has uncovered ancient hydrological systems invisible to optical sensors in the Sahara Desert. Research in eastern Libya used SAR to map paleorivers and groundwater extraction systems associated with early settlements dating to the mid-Holocene humid period. The ability of SAR to detect subsurface moisture and subtle topographic features revealed extensive networks of channels and wells, demonstrating how ancient populations adapted to increasing aridity as the Sahara dried (Chen et al. 2017).
In conflict zones where archaeological sites face looting and destruction, SAR provides monitoring capabilities regardless of cloud cover or security limitations on ground access. In Syria and Iraq, SAR monitoring documented destruction at World Heritage sites like Palmyra and extensive looting patterns across the region. The all-weather capability allowed for consistent monitoring, which was impossible with optical systems due to cloud cover and dust storms.
InSAR applications have proven particularly valuable for monitoring archaeological site stability. At Angkor Wat in Cambodia, millimeter-precision InSAR detected subtle subsidence associated with groundwater extraction threatening temple foundations. Similar techniques monitor structural stability at the Colosseum in Rome and ancient settlements along the retreating Dead Sea coastline, where rapid land subsidence threatens heritage sites.
SAR polarimetry, which analyzes how radar signals change polarization upon ground interaction, has revealed ancient field systems in Europe. Research in the Netherlands used polarimetric SAR to identify Celtic field systems where subtle soil differences remained from ancient agricultural practices. These geometric patterns, nearly invisible on the ground and in optical imagery, appeared clearly in polarimetric SAR data.
Perhaps most impressively, SAR has helped identify ancient irrigation networks in the Andes. Research in the Nazca region of Peru used SAR to map extensive prehistoric canals and aqueducts, many completely buried but detectable through subtle moisture differences and topographic signatures. These hydraulic systems, far more extensive than previously documented, demonstrated sophisticated water management stretching back over 1,500 years.
2. 7. Light Detection and Ranging (LiDAR)
Technique Overview. Light Detection and Ranging (LiDAR) represents one of the most transformative remote sensing technologies for high-precision 3D mapping. LiDAR operates by emitting rapid laser pulses (typically in the near-infrared spectrum) and measuring the time required for reflections to return to the sensor. By precisely timing these returns, LiDAR systems calculate distances to targets with extraordinary accuracy, often achieving vertical precision of a few centimeters even from satellite platforms.
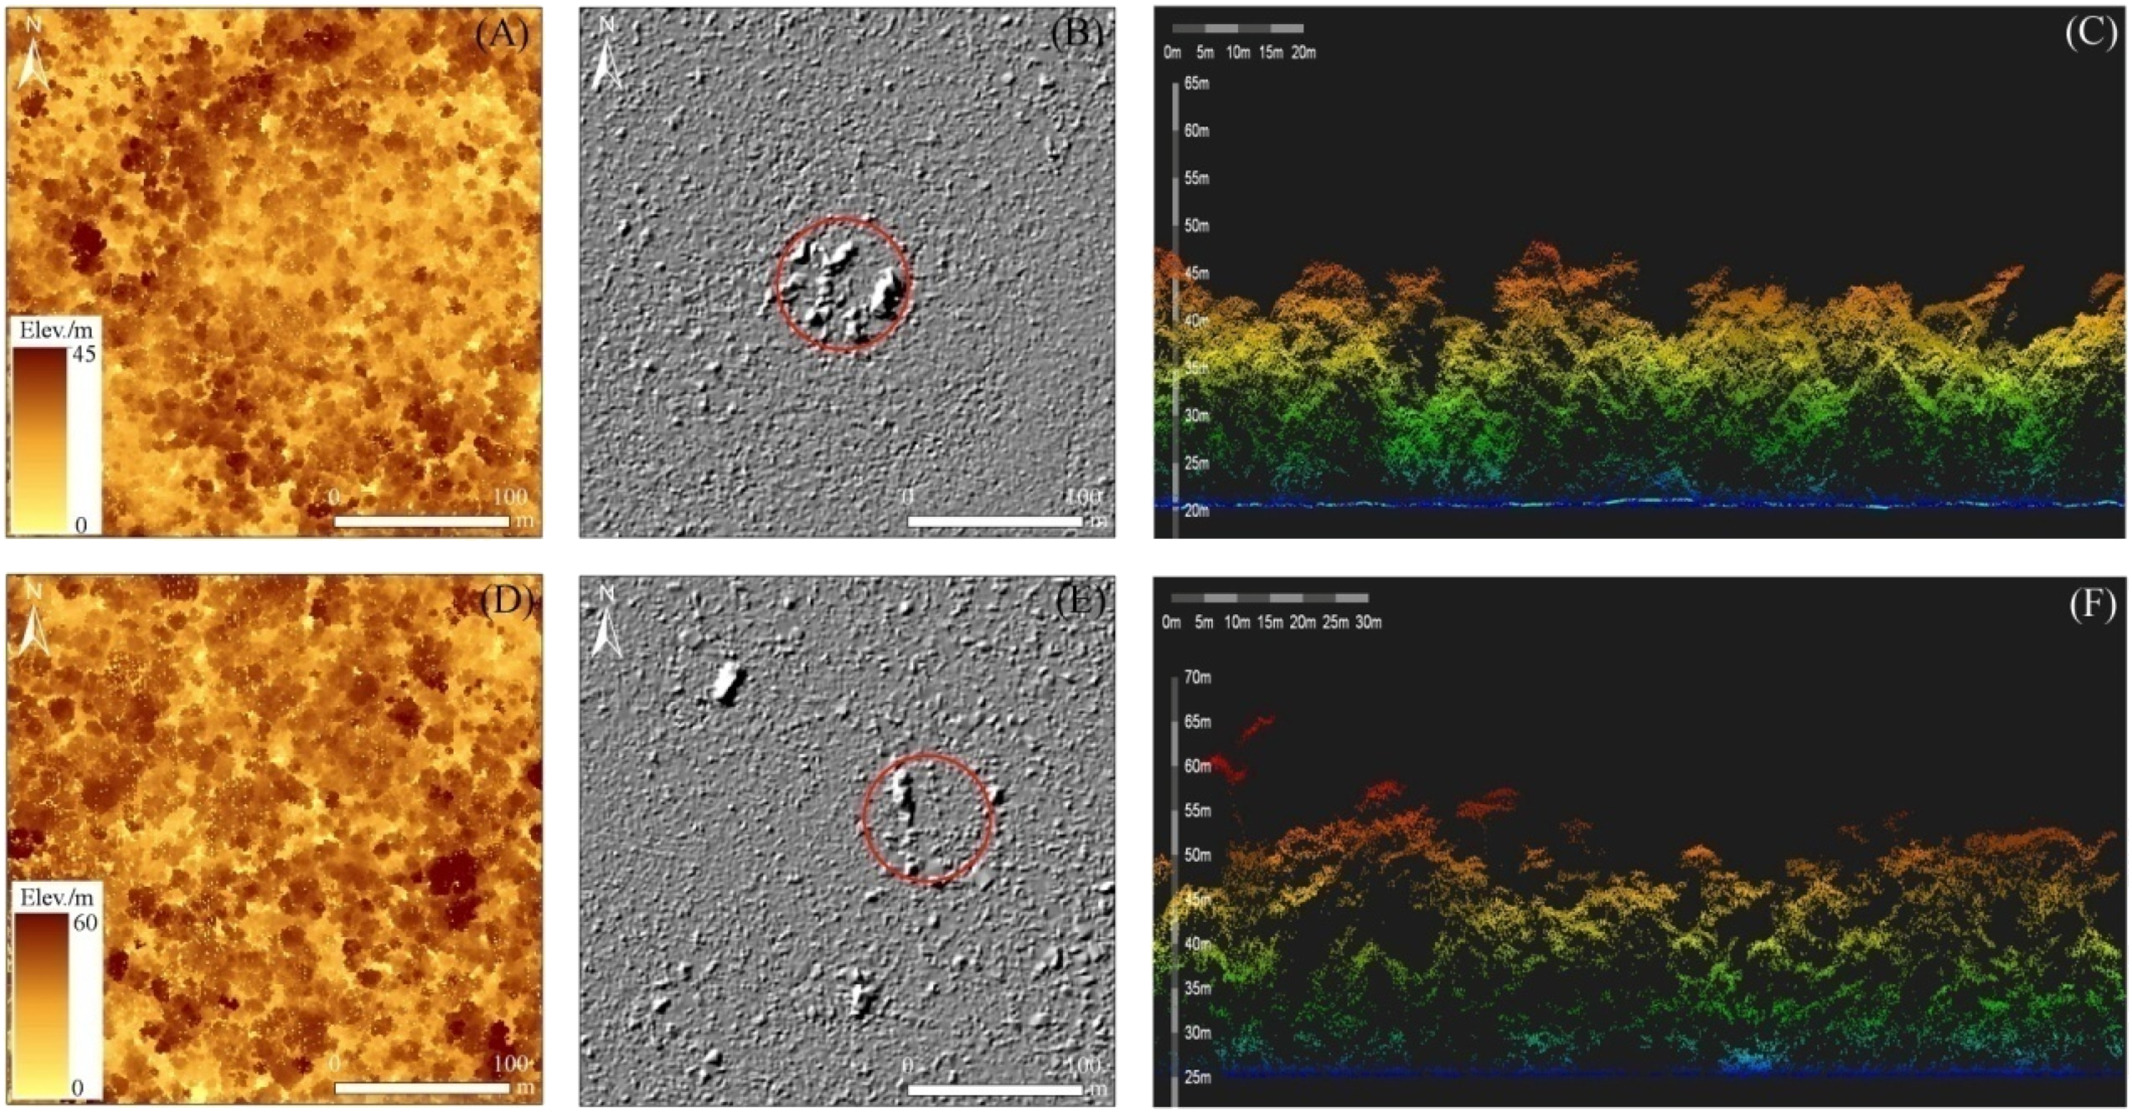
Unlike passive optical sensors, LiDAR actively illuminates its targets, allowing operation day or night, though it cannot penetrate clouds or heavy precipitation. Modern LiDAR systems emit hundreds of thousands to millions of pulses per second, creating dense “point clouds” that precisely characterize surface geometry. These systems record multiple returns from each pulse, capturing not just the first surface encountered (like a forest canopy) but also intermediate layers and the ground beneath, giving LiDAR its remarkable ability to “see through” vegetation.
Satellite LiDAR systems like ICESat-2 use a limited number of laser tracks to sample elevation globally, primarily for monitoring ice sheets, forests, and sea levels. Airborne LiDAR provides much denser coverage over smaller areas, with point densities ranging from 1 to 50 points per square meter, depending on flight parameters. While spaceborne LiDAR offers limited archaeological applications due to low point density, airborne LiDAR has revolutionized landscape archaeology through its ability to create “bare earth” models that digitally remove vegetation cover.
The technology continues advancing rapidly, with new capabilities including bathymetric LiDAR, which can penetrate shallow water, and single-photon LiDAR, which achieves much greater efficiency and range. Full-waveform LiDAR captures the complete shape of the return signal rather than just discrete points, providing even richer information about vegetation structure and ground properties.
Limitations include relatively high data acquisition costs (particularly for airborne surveys), complexity of data processing, and inability to penetrate water (except specialized bathymetric systems) or dense vegetation in tropical environments. Despite these constraints, LiDAR has become essential for high-precision topographic mapping, forestry, infrastructure planning, and archaeological prospection.
Archaeological Applications. LiDAR has transformed archaeology more dramatically than any other remote sensing technique, particularly through its ability to reveal archaeological features beneath vegetation cover. Its capacity to create bare-earth models by filtering out vegetation has rewritten archaeological understanding of sites worldwide (Chase et al. 2011; Štular et al. 2021).
The most spectacular applications have come in tropical forest environments, where traditional survey methods face severe limitations. In Mesoamerica, the 2016 PACUNAM LiDAR Initiative surveyed over 2,100 square kilometers of the Maya Biosphere Reserve in Guatemala, revealing over 60,000 previously undocumented structures hidden beneath dense rainforest canopy. This project transformed the understanding of Maya civilization. It showed population densities far exceeding previous estimates (or even imaginations). Using LiDAR, archaeologists were able to identify extensive urban networks connecting major centers (Canuto et al. 2018). Similar applications in Belize’s Caracol region revealed that this ancient Maya city extended over 200 square kilometers, vastly larger than indicated by previous ground surveys (Chase et al. 2011).
In Southeast Asia, LiDAR completely altered our appreciation for the size of Angkor Wat in Cambodia. Surveys revealed that the Greater Angkor region encompassed over 1,000 square kilometers of interconnected temples, settlements, and water management features, making it the largest preindustrial city in the world. The complex hydraulic engineering systems visible in LiDAR data demonstrated sophisticated environmental management strategies that supported this massive urban complex for centuries (Evans et al. 2013).
In Europe, LiDAR has unveiled ancient landscapes hidden beneath modern forests. In Germany’s Palatinate Forest, LiDAR revealed over 600 previously unknown Celtic burial mounds, Roman settlements, and medieval charcoal production sites preserved beneath forest cover. In England, the New Forest LiDAR survey documented over 3,000 archaeological features spanning from Bronze Age barrows to World War II military installations, all preserved beneath woodland that had protected them from modern development.
LiDAR’s precision has proven particularly valuable for documenting subtle landscape modifications. In the Amazon Basin, LiDAR surveys showed extensive ancient raised field systems and settlement mounds in areas long considered pristine forest (Prümers et al. 2022). Similar applications in North America’s Eastern Woodlands revealed extensive precontact agricultural systems now hidden beneath regrown forests (Casana et al. 2022).
The technology has also invigorated battlefield archaeology. At Gettysburg and other American Civil War sites, LiDAR revealed previously undocumented earthworks, artillery positions, and field fortifications that had become subtle topographic features invisible to ground survey. This precise documentation of battlefield landscapes allows for much more accurate reconstruction of historical events.
Perhaps most significantly for heritage conservation, LiDAR provides baseline documentation of sites threatened by climate change and development. Along coastlines vulnerable to sea level rise, LiDAR surveys document archaeological sites that may be lost in the coming decades. The technique’s ability to rapidly survey large areas makes it possible to document threatened cultural landscapes before they disappear, creating permanent digital records of heritage even if physical preservation proves impossible (Luo et al. 2023).
2.8 Multispectral Imaging
Technique Overview. Multispectral imaging captures data across several discrete bands of the electromagnetic spectrum, typically ranging from visible light through near and shortwave infrared (0.4-2.5 μm). Unlike simple color photography with three bands (red, green, blue), multispectral systems record 4-15 carefully selected wavelength ranges, each chosen to highlight specific surface properties. This approach reveals information invisible to the human eye, including vegetation health, mineral composition, and moisture content.
Like other passive sensors, multispectral systems detect naturally reflected solar radiation, requiring daylight conditions and relatively clear skies. The technology balances spectral detail with practical constraints of satellite operation, selecting specific bands that provide the most valuable information for Earth observation. Common multispectral configurations include visible bands (blue, green, red), near-infrared bands for vegetation analysis, shortwave infrared bands sensitive to moisture and minerals, and occasionally bands designed for specific applications like coastal or aerosol monitoring.
Major satellite systems with multispectral capabilities include Landsat (30m resolution, 8 bands), Sentinel-2 (10-20m, 13 bands), and commercial platforms like WorldView (0.3-1.2m resolution, 8-16 bands). This technology forms the backbone of modern Earth observation programs, offering an optimal balance of spectral information, spatial detail, and coverage area.
A defining characteristic of multispectral imagery is its suitability for quantitative analysis through spectral indices and classification algorithms. Well-established indices like the Normalized Difference Vegetation Index (NDVI), which compares red and near-infrared reflectance, enable quantitative assessment of vegetation health, biomass, and phenology. Similar indices exist for water, built environments, geology, and other surface properties. These standardized measures allow consistent monitoring of environmental change over time.
Multispectral systems balance spectral information with practical considerations of data volume, spatial resolution, and signal-to-noise ratio. While they provide more spectral detail than natural-color imagery, they offer fewer bands than hyperspectral systems, capturing broader spectral regions rather than narrow, contiguous wavelengths. This compromise delivers rich information content while maintaining reasonable data volumes and processing requirements for global-scale Earth observation programs.
Archaeological Applications. Multispectral imaging has transformed archaeological prospection by providing information across multiple wavelengths, revealing patterns invisible to both the human eye and single-band remote sensing. Its ability to capture visible, near-infrared, and shortwave infrared data simultaneously offers unique insights into archaeological landscapes (Lasaponara & Masini 2011; Agapiou et al. 2013).
The technique has proven particularly valuable for identifying ancient settlement patterns in complex landscapes. In Mesopotamia, multispectral analysis combining visible and infrared bands revealed extensive networks of ancient pathways connecting Bronze Age sites. These “hollow ways”—subtle depressions formed by centuries of human and animal movement—appear prominently in multispectral indices that highlight soil moisture differences but remain nearly invisible in single-band imagery. The distribution of these ancient roads helped archaeologists understand economic connections spanning thousands of square kilometers (Agapiou 2019).
Spectral band ratios derived from multispectral imagery have proven especially effective for archaeological site detection in Southwest Asia. Research in Syria’s Orontes Valley used customized spectral indices that highlighted the distinctive soil chemistry of ancient settlement mounds (tells). These techniques revealed dozens of previously undocumented sites and mapped settlement patterns spanning from Neolithic villages through Islamic period cities, revealing dramatic shifts in urban systems over eight millennia of occupation.
Multispectral analysis has proven particularly valuable for identifying ancient water management systems. In Cambodia’s Angkor region, specialized water indices revealed the full extent of the hydraulic infrastructure supporting the medieval Khmer Empire. By analyzing shortwave infrared and near-infrared bands sensitive to soil moisture differences, archaeologists mapped reservoirs, canals, and flood control systems extending far beyond the known temple complexes, demonstrating that Angkor represented one of history’s most extensive hydrological engineering projects (Parcak et al. 2017).
Multispectral techniques help identify ancient activity areas in arid environments through soil chemistry differences. Research in Egypt’s Western Desert used multispectral indices sensitive to clay and mineral content to identify ancient caravan routes and campsite locations, where human activity altered soil composition in ways still detectable centuries later. These spectral traces revealed extensive pre-Islamic and earlier trade routes connecting the Nile Valley with North Africa and sub-Saharan regions.
Multispectral analysis has also advanced archaeological site monitoring and conservation. The UNESCO World Heritage Preservation program uses multispectral satellite monitoring to track looting, encroachment, and environmental threats at archaeological sites worldwide. By developing change detection algorithms using standardized spectral indices, conservationists can identify new threats to archaeological sites across entire regions, allowing more effective prioritization of preservation efforts (Plekhov et al. 2020).
In the Americas, multispectral analysis helped identify extensive raised field agricultural systems in the Bolivian Amazon. Archaeologists mapped complex pre-Columbian agricultural landscapes covering thousands of hectares by combining vegetation indices with soil moisture indicators derived from multispectral imagery. These findings fundamentally revised the understanding of pre-contact Amazonian societies, demonstrating intensive landscape management and supporting much larger populations than previously recognized (Carmona et al. 2020).
2.9 Hyperspectral Imaging
Technique Overview. Hyperspectral imaging represents the pinnacle of spectral remote sensing, capturing hundreds of narrow, contiguous wavelength bands across the electromagnetic spectrum. While multispectral systems might collect 5-15 broad bands, hyperspectral sensors record continuous spectra, often with 200-300 bands at 5-10 nanometer intervals. This extraordinary spectral resolution enables the identification of surface materials with unprecedented precision, detecting subtle features invisible to other sensors.
The technology operates like spectroscopy from space, measuring detailed spectral reflectance or emission properties that serve as diagnostic “fingerprints” for specific materials. Each pixel in a hyperspectral image contains a complete reflectance spectrum, enabling identification of specific minerals, plant species, chemical compounds, and synthetic materials based on their characteristic absorption and reflection features across the electromagnetic spectrum.
Current satellite hyperspectral systems include PRISMA (Italy), DESIS (on International Space Station), EnMAP (Germany), and HISUI (Japan), typically offering 30-300 spectral bands at spatial resolutions of 10-30 meters. Airborne systems like NASA’s AVIRIS and commercial sensors provide even higher spectral and spatial resolution for targeted applications, though at significantly higher cost per area covered.
The extraordinary information content of hyperspectral data enables applications impossible with other sensing techniques, including identification of specific mineral assemblages, precise vegetation species mapping, pollution monitoring, and detection of camouflaged objects. However, this capability comes with significant challenges: the massive data volumes require sophisticated processing techniques, atmospheric correction becomes critically important, and “dimensionality reduction” methods are typically needed to extract meaningful information from hundreds of spectral bands.
Hyperspectral imaging has become essential for advanced Earth observation applications requiring precise material identification, despite the inherent challenges in classification. As processing capabilities advance and newer sensors enter operation, hyperspectral techniques increasingly complement traditional remote sensing approaches for specialized applications requiring detailed spectral analysis.
Archaeological Applications. The extraordinary spectral resolution of hyperspectral imaging has opened new frontiers in archaeological research, allowing precise identification of materials and chemical signatures associated with past human activity. This capability transforms archaeological prospection from simple feature detection to detailed material characterization (Liang 2012; Doneus et al. 2014).
In Mesoamerica, hyperspectral imaging revealed traces of ancient Maya settlements through distinctive chemical signatures in vegetation. Research in Guatemala’s Petén region used spectral analysis to identify specific plant communities growing above limestone ruins, where soil chemistry altered by ancient construction affects modern vegetation in ways detectable only through hyperspectral analysis. This technique identified settlement areas where architectural features had degraded beyond recognition in lidar or SAR data.
Hyperspectral imagery has proven particularly valuable for mapping agricultural soils modified by ancient civilizations. In Amazonia, research used hyperspectral data to map the full extent of “terra preta” (anthropogenic dark earths) created by pre-Columbian populations. These exceptionally fertile soils, created through complex indigenous soil management practices, have distinctive spectral signatures detectable through hyperspectral analysis. Their distribution reveals intensive landscape management practices spanning regions previously considered marginal for agriculture (Alexakis et al. 2009).
In the American Southwest, hyperspectral imaging has helped archaeologists identify ancient turquoise mining districts. The detailed spectral information allows discrimination between natural soil/rock variation and areas altered by ancient mineral extraction. This technique revealed previously unknown mining localities associated with Chaco Canyon and other Ancestral Puebloan centers, helping reconstruct extensive trade networks in this high-value material.
Perhaps most remarkably, hyperspectral imaging has allowed non-destructive characterization of pigments used in ancient rock art and paintings. Research in Australia’s Kakadu National Park used hyperspectral techniques to non-destructively identify specific mineral pigments used in Aboriginal rock paintings, helping establish chronological sequences and cultural connections between sites. Similar applications in the American Southwest allowed identifying specific pigment sources for ancestral Puebloan rock art, establishing trade networks for ceremonial materials (Riris & Gonzalez-Diez 2019).
In Cyprus, hyperspectral surveys were used to investigate Bronze Age copper production. Researchers were able to identify specific mineral alteration signatures associated with ancient smelting. The allowed them to map the extent of metallurgical landscapes supporting copper export during the Late Bronze Age. These industrial zones, far more extensive than previously recognized, demonstrated that Cyprus’s role in Mediterranean metal trade was substantially larger than archaeological excavation had suggested (Atzberger et al. 2014).
For heritage conservation, hyperspectral imaging provides extraordinary capabilities for monitoring deterioration processes. At Pompeii, hyperspectral surveys identified specific salt crystallization patterns threatening frescoes and structures. The allowed conservators to target interventions before visible damage occurred. The technique similarly helps monitor biodeterioration at stone monuments worldwide by identifying specific microorganisms colonizing surfaces before they create visible damage.
Perhaps most remarkably, hyperspectral imaging can detect previously invisible artwork and inscriptions. At Egypt’s Valley of the Kings, specialized processing of hyperspectral imagery revealed hieroglyphs and pictorial elements no longer visible to the naked eye, recovering texts lost to deterioration. Similar techniques have recovered faded text on the Dead Sea Scrolls and other ancient documents, demonstrating hyperspectral imaging’s unique value for conservation and textual recovery.
2.10 GNSS Reflectometry
Technique Overview. GNSS Reflectometry (GNSS-R) is an ingenious remote sensing technique that repurposes signals from Global Navigation Satellite Systems (GPS, GLONASS, Galileo, etc.) to gather information about Earth’s surface. Unlike conventional sensors that either detect natural emissions or generate their own signals, GNSS-R exploits existing navigation signals that reflect off Earth’s surface before reaching the receiver. By analyzing how these signals are modified during reflection, the technique provides unique information about surface properties.
The fundamental concept is “bistatic radar”—where the transmitter (GNSS satellites) and receiver are in different locations. When GNSS signals bounce off Earth’s surface, they are altered based on the surface’s roughness, dielectric properties, and geometry. By comparing direct signals from satellites with their reflected counterparts, GNSS-R can determine properties like soil moisture, ocean surface roughness, wind speed, sea ice coverage, and snow depth.
This approach offers several unique advantages. GNSS signals penetrate clouds and precipitation, allowing all-weather operation. The technique uses existing GNSS signal infrastructure, eliminating the need for dedicated transmitters. Multiple satellite constellations provide global coverage and frequent observations, enabling monitoring of rapidly changing conditions like soil moisture after rainfall events or flooding.
Current operational systems using GNSS-R include NASA’s CYGNSS (Cyclone Global Navigation Satellite System), a constellation designed for hurricane monitoring, and sensors aboard satellites like TechDemoSat-1. These systems achieve spatial resolutions of approximately 10-25 kilometers, coarser than imaging systems but valuable for monitoring dynamic processes like soil moisture change and coastal flooding.
The primary advantages include all-weather operation (GNSS signals penetrate clouds and precipitation), the ability to measure properties like soil moisture that are difficult to observe with conventional sensors, and the relatively low cost of receivers that don’t require signal generation capabilities. Limitations include relatively coarse spatial resolution and complex signal processing requirements to extract meaningful information from reflected signals.
As a rapidly evolving technology, GNSS Reflectometry continues expanding into new applications, including wetland monitoring, snow depth measurement, and forest biomass estimation. It complements traditional remote sensing techniques with unique measurement capabilities.
Archaeological Applications. While GNSS Reflectometry represents a relatively new technique with coarser resolution than traditional archaeological remote sensing methods, it offers unique capabilities for landscape-scale analysis and environmental reconstruction relevant to archaeological research.
GNSS Reflectometry has proven valuable in coastal archaeology for documenting sea-level changes affecting ancient maritime sites. Research along the Mediterranean coast used GNSS-R data to map subtle shoreline changes around ancient harbor sites like Caesarea Maritima, where sea level rise has partially submerged Roman port facilities. The technique’s ability to precisely track shoreline position regardless of cloud cover or tides helps archaeologists reconstruct ancient maritime landscapes and assess future threats to coastal heritage from climate change.
GNSS-R soil moisture monitoring helps identify ancient occupation areas in dynamic environments for wetland archaeology. Studies in the Florida Everglades used GNSS-R to map elevated tree islands where pre-Columbian settlements concentrated. These slightly drier areas, detectable through soil moisture patterns measured by GNSS-R, revealed occupation patterns spanning thousands of years in landscapes that seem homogeneous in visual imagery.
The technology has proven particularly valuable for monitoring archaeological sites in flood-prone regions. In Bangladesh’s Ganges-Brahmaputra delta, GNSS-R flood detection helps monitor inundation patterns around archaeological sites, allowing cultural heritage managers to prioritize emergency documentation of threatened sites during monsoon seasons—similar applications in Mesopotamia track seasonal flooding threatening archaeological sites along the Tigris and Euphrates rivers.
GNSS-R’s ability to measure soil moisture at coarse resolution complements higher-resolution techniques for landscape archaeology. Research in the Maya lowlands combined GNSS-R soil moisture patterns with LiDAR topographic data to identify ancient agricultural zones where modified soils retain moisture differently than surrounding areas. This multi-sensor approach revealed landscape management strategies that would be difficult to detect with either technique alone.
For historical ecology research, GNSS-R techniques help reconstruct past environmental conditions relevant to archaeological interpretations. In the Nile Valley, researchers used GNSS-R soil moisture time series to identify remnant signatures of ancient irrigation systems still affecting modern soil hydrology. These persistent patterns helped archaeologists map the extent of ancient Egyptian floodwater management systems that transformed the Nile floodplain for agricultural production.
While the coarse resolution of current GNSS-R systems (10-25km) limits direct archaeological application at the site level, the technology’s unique sensitivity to soil moisture, flooding, and coastal processes makes it increasingly valuable for regional-scale landscape archaeology and environmental reconstruction. As part of multi-sensor approaches combining high-resolution imagery and topographic data with GNSS-R’s unique moisture sensitivity, the technique contributes valuable insights into human-landscape interactions across archaeological timescales.
Table 1. Characteristics, Limits, and Applications of Satellite Remote Sensing Techniques.
| Method | Energy Source | Type | Weather Capability | Resolution | Applications | Examples | Strengths | Limitations |
| Optical/Visual | Reflected sunlight (0.4-0.7 μm) | Passive | Cannot penetrate clouds, smoke, or darkness | Very high spatial (0.3-30m) | Land use mapping, agriculture monitoring, urban planning | Landsat, Sentinel-2, WorldView | Intuitive interpretation, high detail | Weather dependent, requires daylight |
| Near-Infrared (NIR) | Reflected sunlight (0.7-1.4 μm) | Passive | Limited cloud penetration | Similar to optical (0.3-30m) | Vegetation health, water mapping | Landsat NIR bands, Sentinel-2 bands 8/8A | Excellent for vegetation analysis | Weather dependent, requires daylight |
| Short-wave Infrared (SWIR) | Reflected sunlight (1.4-3.0 μm) | Passive | Better cloud penetration than visual | Moderate (10-100m) | Mineral mapping, geology, fire detection | Landsat SWIR bands, Sentinel-2 bands 11/12 | Good material discrimination | Lower resolution than visual |
| Thermal Infrared (TIR) | Emitted thermal radiation (3.0-14.0 μm) | Passive | Works day and night | Coarser (60-1000m) | Surface temperature, volcanic monitoring | Landsat TIR bands, MODIS thermal | Works at night, measures temperature | Coarser resolution |
| Passive Microwave | Natural microwave emissions (0.1-100 cm) | Passive | Excellent all-weather | Very coarse (5-50km) | Soil moisture, ocean salinity, sea ice | SMOS, SMAP, AMSR-E/2 | All-weather capability | Very coarse resolution |
| SAR | Transmitted microwave signals (1-100 cm) | Active | Excellent – penetrates clouds, rain, darkness | Moderate to high (1-100m) | All-weather imaging, deformation monitoring | Sentinel-1, RADARSAT | Works in all conditions | Complex interpretation |
| LiDAR | Laser pulses (near-infrared) | Active | Cannot penetrate clouds | Extremely high vertical (cm-scale) | 3D mapping, forest structure | ICESat-2, GEDI | Unmatched vertical accuracy | Limited coverage from satellites |
| Multispectral | Reflected sunlight (various bands) | Passive | Cannot penetrate clouds | Moderate to high (0.5-30m) | Land classification, vegetation indices | Landsat, Sentinel-2 (10-13 bands) | Good spectral-spatial balance | Weather dependent |
| Hyperspectral | Reflected sunlight (hundreds of bands) | Passive | Cannot penetrate clouds | Moderate (10-30m) | Material identification, mineral mapping | PRISMA, EnMAP, DESIS | Detailed spectral information | Complex processing, large data volumes |
| GNSS Reflectometry | Reflected GPS/GNSS signals | Passive use of active signals | All-weather | Coarse (10-50km) | Soil moisture, ocean wind speed | CYGNSS, TechDemoSat-1 | Global coverage | Emerging technique, coarse resolution |
3.0 Concluding comments
The rapid evolution of satellite remote sensing technologies has fundamentally transformed archaeological practice, enabling researchers to detect, document, and analyze ancient sites and landscapes at unprecedented scales and resolutions. What began as occasional aerial photography has matured into a sophisticated archaeological subdiscipline leveraging multiple regions of the electromagnetic spectrum to reveal traces of past human activity invisible to ground-based observation. This technological revolution has not simply provided new tools for existing research questions—it has expanded the scope of archaeological inquiry, enabling landscape-scale investigation of ancient settlement systems, agricultural practices, and environmental modifications (Lasaponara & Masini 2011; Luo et al. 2019, 2022).
All these techniques have complementary capabilities for archaeological prospection. Each provides unique insights into different aspects of the archaeological record. These and other case studies demonstrate that no single technology provides a comprehensive solution for archaeological remote sensing. Instead, integrating multiple techniques—combining the vegetation sensitivity of near-infrared, the all-weather capabilities of SAR, the topographic precision of LiDAR, and the material identification power of hyperspectral imaging—yields the most comprehensive understanding of archaeological landscapes (Opitz & Herrmann 2018; Davis & Douglass 2020). This multi-sensor approach has become standard practice in major archaeological remote sensing projects worldwide. This approach overcomes the limitations of individual technologies through the data integration of different sensors.
Perhaps the most profound impact of satellite remote sensing has been the democratization of archaeological discovery. Features that might require decades to document through traditional ground survey can now be mapped in weeks, allowing systematic documentation of entire cultural landscapes rather than isolated sites. This broader perspective has revealed that many ancient societies modified their environments far more extensively than previously recognized, supporting larger populations and creating more complex infrastructure networks than earlier archaeological methods could detect (Canuto et al. 2018; Prümers et al. 2022). From the Maya lowlands to the Amazon basin, from Mesopotamia to Southeast Asia, remote sensing has consistently revealed greater human impact on ancient landscapes and challenged longstanding assumptions about the scale and intensity of past human activity.
In an era of accelerating climate change, development pressure, and political instability, satellite remote sensing has become the tool for cultural heritage preservation. These technologies enable rapid documentation of threatened archaeological landscapes and create a permanent digital record of sites that may be damaged or destroyed before traditional documentation is possible (Parcak et al. 2016; Khalaf & Insoll 2019). The all-weather capabilities of SAR and thermal sensors, combined with the global coverage of satellite platforms, allow archaeological sites to be monitored in conflict zones and remote regions where ground access is impossible. This preservation function moves cultural heritage monitoring from reactive to proactive.
Despite these capabilities, significant challenges remain. The most powerful remote sensing technologies—particularly airborne LiDAR and hyperspectral imaging—remain costly and inaccessible to many archaeological projects, creating disparities in technological application across regions. Data processing workflows require specialized expertise that is not yet standardized in archaeological education, limiting broader adoption. Some archaeologists might argue that there is an overemphasis on remotely-sensed data without appropriate ground validation. This might be true, and it raises methodological concerns about the reliability of archaeological interpretations. However, the advantages far outweigh any critiques. Today, these methods and technologies complement what many consider to be traditional archaeological methods, although they are rapidly becoming mainstream practices.
Looking forward, emerging satellite technologies promise further evolution in archaeological remote sensing. Miniaturization of sensors enables drone-based platforms that bridge the gap between satellite coverage and ground survey (Stek 2016; Casana et al. 2022). Artificial intelligence and machine learning increasingly automate feature detection across massive datasets, potentially revealing patterns beyond human visual interpretation. Temporal analysis of multi-year imagery enables monitoring of subtle environmental changes affecting heritage sites, while integration with paleoenvironmental data provides crucial context for understanding ancient human-environment interactions.
Satellite remote sensing challenges archaeologists to expand conceptual frameworks beyond individual sites, and to embrace research on the entire landscapes of human activity. These technologies reveal ancient worlds not as isolated monuments but as complex systems of settlements, infrastructure, agricultural landscapes, and environmental management extending across vast regions. This perspective enriches understanding of past societies and provides valuable insights into long-term human-environment relationships that are increasingly relevant to contemporary sustainability challenges. By revealing these ancient landscapes, satellite remote sensing contributes to archaeological knowledge and a broader understanding of humanity’s enduring relationship with Earth’s environments.
4.0 References cited
Agapiou, A., D.D. Alexakis, A. Sarris & D.G. Hadjimitsis. 2013. Evaluating the potentials of Sentinel-2 for archaeological perspective. Remote Sensing 6(2): 2176–2194.
Alexakis, D., A. Sarris, T. Astaras & K. Albanakis. 2009. Detection of Neolithic settlements in Thessaly (Greece) through multispectral and hyperspectral satellite imagery. Sensors 9(2): 1167–1187. https://doi.org/10.3390/s90201167
Atzberger, C., M. Wess, M. Doneus & G. Verhoeven. 2014. ARCTIS—A MATLAB® toolbox for archaeological imaging spectroscopy. Remote Sensing 6(9): 8617–8638. https://doi.org/10.3390/rs6098617
Bayarri, V., Sebastián, M. A., & Ripoll, S. (2019). Hyperspectral imaging techniques for the study, conservation and management of rock art. Applied Sciences, 9(23), 5011.
Brooke, C. (2018). Thermal imaging for the archaeological investigation of historic buildings. Remote Sensing, 10(9), 1401.
Brooke, C., & Clutterbuck, B. (2019). Mapping heterogeneous buried archaeological features using multisensor data from unmanned aerial vehicles. Remote Sensing, 12(1), 41.
Canuto, M.A., F. Estrada-Belli, T.G. Garrison, S.D. Houston, M.J. Acuña, M. Kováč, D. Marken, P. Nondédéo, L. Auld-Thomas, C. Castanet, D. Chatelain, C.R. Chiriboga, T. Drápela, T. Lieskovský, A. Tokovinine, A. Velasquez, J.C. Fernández-Díaz & R. Shrestha. 2018. Ancient lowland Maya complexity as revealed by airborne laser scanning of northern Guatemala. Science 361(6409): eaau0137. https://doi.org/10.1126/science.aau0137
Carmona, J.A.S., E. Quiros, V. Mayoral & C. Charro. 2020. Assessing the potential of multispectral and thermal UAV imagery from archaeological sites. A case study from the Iron Age hillfort of Villasviejas del Tamuja (Cáceres, Spain). Journal of Archaeological Science: Reports 31: 102312. https://doi.org/10.1016/j.jasrep.2020.102312
Casana, J. & C. Ferwerda. 2023. Archaeological prospection using WorldView-3 short-wave infrared (SWIR) satellite imagery: case studies from the Fertile Crescent. Archaeological Prospection 30(3): 327–340. https://doi.org/10.1002/arp.1895
Casana, J., A. Wiewel, A. Cool, A.C. Hill, K.D. Fisher & E.J. Laugier. 2017. Archaeological aerial thermography in theory and practice. Advances in Archaeological Practice 5(4): 310–327. https://doi.org/10.1017/aap.2017.23
Chase, A.F., D.Z. Chase, J.F. Weishampel, J.B. Drake, R.L. Shrestha, K.C. Slatton, J.J. Awe & W.E. Carter. 2011. Airborne LiDAR, archaeology, and the ancient Maya landscape at Caracol, Belize. Journal of Archaeological Science 38(2): 387–398. https://doi.org/10.1016/j.jas.2010.09.018
Chen, F., R. Lasaponara & N. Masini. 2017. An overview of satellite Synthetic Aperture Radar remote sensing in archaeology: from site detection to monitoring. Journal of Cultural Heritage 23: 5–11. https://doi.org/10.1016/j.culher.2015.05.003
Comer, D.C. & R.G. Blom. 2006. Detection and identification of archaeological sites and features using Synthetic Aperture Radar (SAR) data collected from airborne platforms, in J. Wiseman & F. El-Baz (ed.) Remote sensing in archaeology: 103–136. Springer. https://doi.org/10.1007/0-387-44455-6_5
Custer, J.F., T. Eveleigh, V. Klemas & I. Wells. 1986. Application of Landsat data and synoptic remote sensing to predictive models for prehistoric archaeological sites: an example from the Delaware Coastal Plain. American Antiquity 51(3): 572–588. https://doi.org/10.2307/280906
Davis, D. S. (2017). The applicability of short-wave infrared (SWIR) imagery for archaeological landscape classification on Rapa Nui (Easter Island), Chile. Binghamton University Undergraduate Journal, 3(1), 7.
Davis, D.S. & K. Douglass. 2020. Aerial and spaceborne remote sensing in African archaeology: a review of current research and potential future avenues. African Archaeological Review 37(1): 9–24.
Doneus, M., G. Verhoeven, C. Atzberger, M. Wess & M. Ruš. 2014. New ways to extract archaeological information from hyperspectral pixels. Journal of Archaeological Science 52: 84–96. https://doi.org/10.1016/j.jas.2014.08.023
Estrada-Belli, F., L. Gilabert-Sansalvador, M.A. Canuto, I. Šprajc & J.C. Fernandez-Diaz. 2023. Architecture, wealth and status in Classic Maya urbanism revealed by airborne lidar mapping. Journal of Archaeological Science 157: 105835. https://doi.org/10.1016/j.jas.2023.105835
Evans, D.H., R.J. Fletcher, C. Pottier, J.-B. Chevance, D. Soutif, B.S. Tan, S. Im, D. Ea, T. Tin, S. Kim, C. Cromarty, S. De Greef, K. Hanus, P. Bâty, R. Kuszinger, I. Shimoda & G. Boornazian. 2013. Uncovering archaeological landscapes at Angkor using lidar. Proceedings of the National Academy of Sciences 110(31): 12595–12600. https://doi.org/10.1073/pnas.1306539110
Hill, A.C., E.J. Laugier & J. Casana. 2020. Archaeological remote sensing using multi-temporal, drone-acquired thermal and near infrared (NIR) imagery: a case study at the Enfield Shaker Village, New Hampshire. Remote Sensing 12(4): 690. https://doi.org/10.3390/rs12040690
Kalayci T, Lasaponara R, Wainwright J, Masini N. Multispectral Contrast of Archaeological Features: A Quantitative Evaluation. Remote Sensing. 2019; 11(8):913. https://doi.org/10.3390/rs11080913
Kalayci, T., Lasaponara, R., Wainwright, J., & Masini, N. (2019). Multispectral contrast of archaeological features: A quantitative evaluation. Remote Sensing, 11(8), 913.
Khalaf, N. & T. Insoll. 2019. Monitoring Islamic archaeological landscapes in Ethiopia using open source satellite imagery. Journal of Field Archaeology 44(6): 401–419. https://doi.org/10.1080/00934690.2019.1629311
Lasaponara, R. & N. Masini. 2011. Satellite remote sensing in archaeology: past, present and future perspectives. Journal of Archaeological Science 38(9): 1995–2002. https://doi.org/10.1016/j.jas.2011.02.002
Liang, H. 2012. Advances in multispectral and hyperspectral imaging for archaeology and art conservation. Applied Physics A 106(2): 309–323. https://doi.org/10.1007/s00339-011-6689-1
Luo, L., X. Wang & H. Guo. 2022. Remote sensing archaeology: the next century. The Innovation 3(6): 100335. https://doi.org/10.1016/j.xinn.2022.100335
Luo, L., X. Wang, H. Guo, R. Lasaponara, X. Zong, N. Masini, G. Wang, P. Shi, H. Khatteli, F. Chen, S. Tariq, J. Shao, N. Bachagha, R. Yang & Y. Yao. 2019. Airborne and spaceborne remote sensing for archaeological and cultural heritage applications: a review of the century (1907-2017). Remote Sensing of Environment 232: 111280. https://doi.org/10.1016/j.rse.2019.111280
Luo, L., Zong, X., Shao, J., Wang, X., & Guo, H. (2023). LiDARchaeology: A revolutionary approach to archaeological prospection in forested areas. The Innovation Geoscience, 1(2), 100017.https://doi.org/10.59717/j.xinn-geo.2023.100017
Materazzi, F. & M. Pacifici. 2022. Archaeological crop marks detection through drone multispectral remote sensing and vegetation indices: a new approach tested on the Italian pre-Roman city of Veii. Journal of Archaeological Science: Reports 41: 103235
McCoy, M. D., & Ladefoged, T. N. (2009). New developments in the use of spatial technology in archaeology. Journal of Archaeological Research, 17, 263-295.
Monterroso Checa A, Martínez Reche T. COSMO SkyMed X-Band SAR application – combined with thermal and RGB images – in the archaeological landscape of Roman Mellaria (Fuente Obejuna-Córdoba, Spain). Archaeological Prospection. 2018; 25: 301–314. https://doi.org/10.1002/arp.1709
Monterroso Checa, A., & Martínez Reche, T. (2018). COSMO SkyMed X‐Band SAR application–combined with thermal and RGB images–in the archaeological landscape of Roman Mellaria (Fuente Obejuna‐Córdoba, Spain). Archaeological Prospection, 25(4), 301-314.
Opitz, R. & J. Herrmann. 2018. Recent trends and long-standing problems in archaeological remote sensing. Journal of Computer Applications in Archaeology 1(1): 19–41. https://doi.org/10.5334/jcaa.11
Parcak, S. 2017. Moving from space-based to ground-based solutions in remote sensing for archaeological heritage: a case study from Egypt. Remote Sensing 9(12): 1297. https://doi.org/10.3390/rs9121297
Parcak, S., D. Gathings, C. Childs, G. Mumford & E. Cline. 2016. Satellite evidence of archaeological site looting in Egypt: 2002–2013. Antiquity 90(353): 188–205. https://doi.org/10.15184/aqy.2016.1
Parcak, S., G. Mumford & C. Childs. 2017. Using open access satellite data alongside ground based remote sensing: an assessment, with case studies from Egypt’s Delta. Geosciences 7(4): 94. https://doi.org/10.3390/geosciences7040094
Philip, G., D. Donoghue, A.R. Beck & N. Galiatsatos. 2002. CORONA satellite photography: an archaeological application from the Middle East. Antiquity 76(291): 109–118.
Plekhov, D., L.R. Gosner, A.J. Smith & J. Nowlin. 2020. Applications of satellite remote sensing for archaeological survey: a case study from the Sinis Archaeological Project, Sardinia. Advances in Archaeological Practice 8(2): 192–205. https://doi.org/10.1017/aap.2020.9
Prümers, H., C. Jaimes Betancourt, J. Iriarte, M. Robinson & M. Schaich. 2022. Lidar reveals pre-Hispanic low-density urbanism in the Bolivian Amazon. Nature 606(7913): 325–328. https://doi.org/10.1038/s41586-022-04780-4
Stek, T.D. 2016. Drones over Mediterranean landscapes. The potential of small UAV’s (drones) for site detection and heritage management in archaeological survey projects: a case study from Le Pianelle in the Tappino Valley, Molise (Italy). Journal of Cultural Heritage 22: 1066–1071. https://doi.org/10.1016/j.culher.2016.06.006
Stewart, C., R. Montanaro, M. Sala & P. Riccardi. 2016. Feature extraction in the North Sinai Desert using spaceborne Synthetic Aperture Radar: potential archaeological applications. Remote Sensing 8(10): 825. https://doi.org/10.3390/rs8100825
Štular, B., E. Lozić & S. Eichert. 2021. Airborne LiDAR-derived digital elevation model for archaeology. Remote Sensing 13(9): 1855. https://doi.org/10.3390/rs13091855
Tapete, D., & Cigna, F. (2017). Trends and perspectives of space-borne SAR remote sensing for archaeological landscape and cultural heritage applications. Journal of Archaeological Science: Reports, 14, 716-726.
Verhoeven, G.J. Near-Infrared Aerial Crop Mark Archaeology: From its Historical Use to Current Digital Implementations. J Archaeol Method Theory 19, 132–160 (2012). https://doi.org/10.1007/s10816-011-9104-5
Verhoeven, G.J.J. 2008. Imaging the invisible using modified digital still cameras for straightforward and low-cost archaeological near-infrared photography. Journal of Archaeological Science 35(12): 3087–3100
Walker, S. 2020. Low-altitude aerial thermography for the archaeological investigation of arctic landscapes. Journal of Archaeological Science 117: 105126. https://doi.org/10.1016/j.jas.2020.105126
Zingaro M, Scicchitano G, Capolongo D. The Innovative Growth of Space Archaeology: A Brief Overview of Concepts and Approaches in Detection, Monitoring, and Promotion of the Archaeological Heritage. Remote Sensing. 2023; 15(12):3049. https://doi.org/10.3390/rs15123049
Zingaro, M., Scicchitano, G., & Capolongo, D. (2023). The Innovative growth of space archaeology: a brief overview of concepts and approaches in detection, monitoring, and promotion of the archaeological heritage. Remote Sensing, 15(12), 3049.
Peer Review History
There is no reviews yet
Conflict of Interest Statement
The authors declare that they have no conflict of interest.
Funding Statement
This research received no specific grant from any funding agency in the public, commercial, or not-for-profit sectors.